Yahoo!ニュースを眺めていて見かけた「一発ジャンケン」が、プログラミングの教材として良さげだったので、実際に簡単なプログラムを組んでみました。ルールは以下の通りです(記事からの抜粋)。
まず、1~5を指で出す。数字が大きい人が勝ちなので5が一番強いが、他の人と同じ数字を出した人は負けとなる。5は強いが被りやすいという難点がある。ただ、残りが5と1なら革命で1が勝ちとなる。
import collections
import random


def determine_winner(choices):
    agg = collections.Counter(choices)
    only_one_choice = [i for i in agg.keys() if agg[i] == 1]
    if not only_one_choice:
        return 999, 999
    elif set(only_one_choice) == set([1, 5]):
        return choices.index(1), 1
    else:
        return choices.index(max(only_one_choice)), max(only_one_choice)


if __name__ == "__main__":

    LARGE_NUMBER = 100000
    N = 30

    store = []
    win_choice = []
    for n in range(5, N):
        results = [
            determine_winner([random.randint(1, 5) for _ in range(n)])
            for _ in range(LARGE_NUMBER)
        ]
        store.append(
            collections.Counter([result[0] for result in results])[999] / LARGE_NUMBER
        )
        win_choice.append(collections.Counter([result[1] for result in results]))
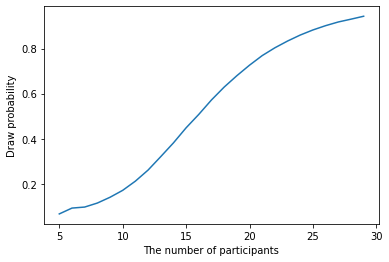
参加者数ごとの引き分けが発生する確率は以下の通りです。
import pandas as pd


df = pd.DataFrame({
    "The number of participants": range(5, N),
    "Draw probability": store,
})
df.index = df["The number of participants"]
df["Draw probability"].plot(xlabel="The number of participants", ylabel="Draw probability")
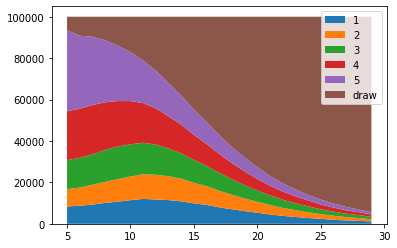
参加者数ごとの勝者となる手は以下の通りです。
import matplotlib.pyplot as plt


v1 = [wc[1] for wc in win_choice]
v2 = [wc[2] for wc in win_choice]
v3 = [wc[3] for wc in win_choice]
v4 = [wc[4] for wc in win_choice]
v5 = [wc[5] for wc in win_choice]
v999 = [wc[999] for wc in win_choice]
labels = ["1", "2", "3", "4", "5", "draw"]
fig, ax = plt.subplots()
ax.stackplot(range(5, N), v1, v2, v3, v4, v5, v999, labels=labels)
ax.legend(loc='upper right')
plt.show()