問題文
問題の概要
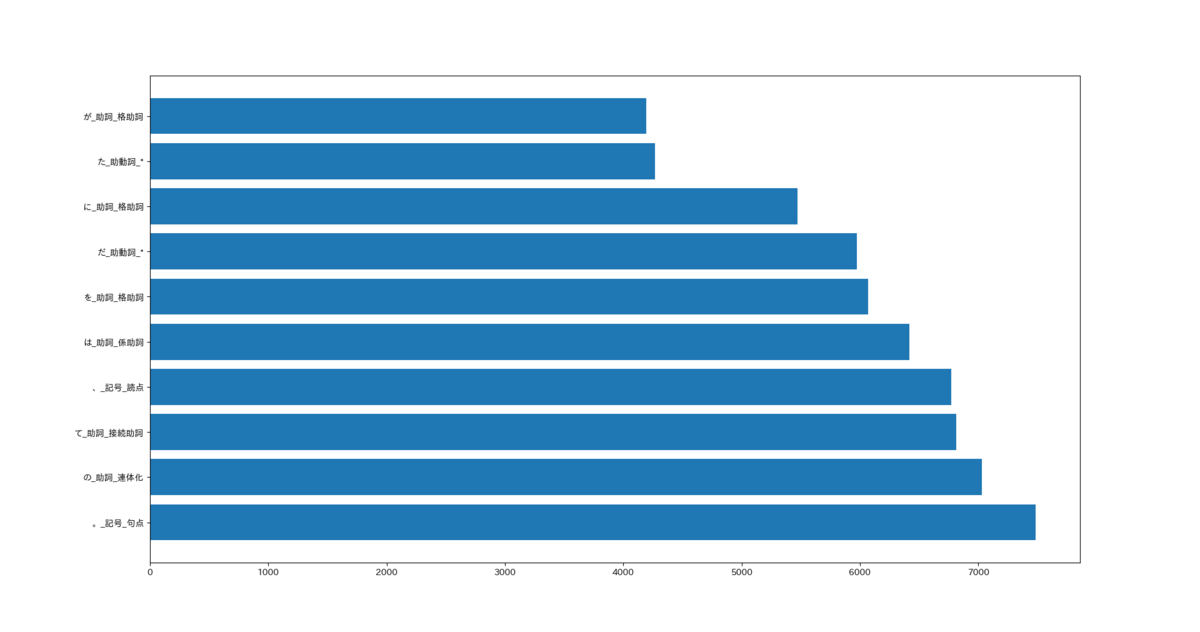
35. 単語の出現頻度の結果の上位10件を棒グラフで可視化するだけです。
可視化ライブラリとしては「matplotlib」を使っています。日本語が文字化けする現象には「japanize_matplotlib」*1で対応しています。
from collections import defaultdict
import matplotlib.pyplot as plt
import japanize_matplotlib


def parse_mecab(block):
    res = []
    for line in block.split('\n'):
        if line == '':
            return res
        (surface, attr) = line.split('\t')
        attr = attr.split(',')
        lineDict = {
            'surface': surface,
            'base': attr[6],
            'pos': attr[0],
            'pos1': attr[1]
        }
        res.append(lineDict)


def extract_words(block):
    return [b['base'] + '_' + b['pos'] + '_' + b['pos1'] for b in block]


filename = 'ch04/neko.txt.mecab'
with open(filename, mode='rt', encoding='utf-8') as f:
    blocks = f.read().split('EOS\n')
blocks = list(filter(lambda x: x != '', blocks))
blocks = [parse_mecab(block) for block in blocks]
words = [extract_words(block) for block in blocks]
d = defaultdict(int)
for word in words:
    for w in word:
        d[w] += 1
ans = sorted(d.items(), key=lambda x: x[1], reverse=True)[:10]
labels = [a[0] for a in ans]
values = [a[1] for a in ans]

plt.figure(figsize=(15, 8))
plt.barh(labels, values)
plt.savefig('ch04/ans36.png')
